You are here
Home ›Autumn Survey - 2018 results!
Hurrah, you did it! Give yourselves a pat on the back, your Autumn Surveys are complete and we have some of the results to share with you.
Rainbow Lorikeets still on top!
For our first Birds in Backyards seasonal survey, 175 people surveyed 210 sites around the country and counted a total of 16,698 birds across 222 species. Not a bad effort, team!
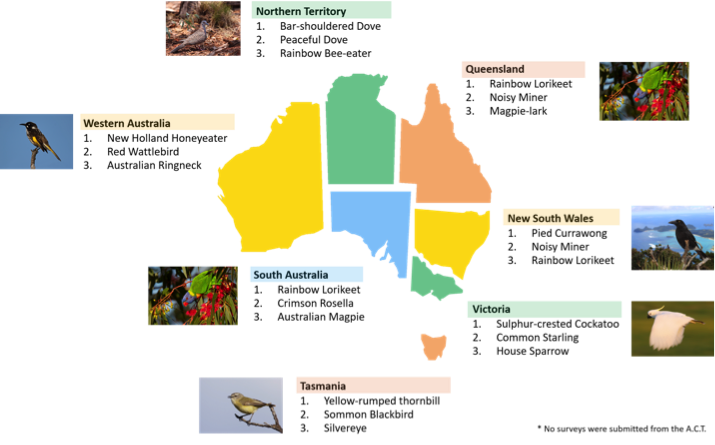
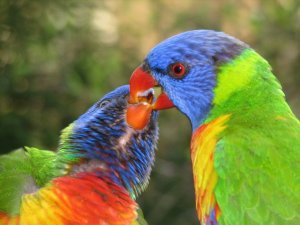
Rainbow Lorikeets topped the surveys, appearing in the top 10 lists for NSW, Queensland, Victoria and South Australia. These colourful, loud little parrots are the most frequently counted birds in both the Birds in Backyard surveys and the annual week-long Aussie Backyard Bird Count. Catch up on Holly’s blog post "Rainbow Lorikeets: Fun facts about a fun bird" to learn more about these playful birds.
Your top ten birds nationally (with percent of total birds counted in brackets) were:
- Rainbow Lorikeet (9%)
- Noisy Miner (8%)
- Pied Currawong (7%)
- Australian Magpie (4%)
- Sulphur-crested Cockatoo (4%)
- Common Starling (3%)
- Crested Pigeon (3%)
- House Sparrow (3%)
- Galah (2%)
- Magpie Lark (2%)
A keen eye will note that the percentage of each species surveyed are quite small. This is probably because of the 222 species that were counted, each species only appears once or twice across a survey and so numbers are spread out. So the top ten birds barely squeezed over the line. But the really excellent news is that you are observing a really good diversity of birds in your spaces!
BIBY autumn survey results.png

Surveying birds? There’s an app for that!
The full version of the Birds in Backyards survey on the Birdata app is on its way. 62% of your surveys were complete – that means that all of the site details were filled in. If you are already completing your surveys on the app, be sure to log into Birdata online and complete your surveys. You’ll only need to do this once, but this information help us to track bird communities against habitat data, what other animals visit your space, and even whether you have any interesting interactions between birds. Your seasonal survey is more than just counting birds. And with each seasonal survey result, we’ll dive into different details.
Super Surveyor Stats
- 68% of you submitted just one survey, but a handful of super surveyors (4%) submitted more than 10! This Winter Survey, why not try counting once or twice more?
- Around 30% of you identified as beginners – welcome! It will be interesting to see how your backyard birding journey changes your experience level and confidence in identifying birds. And thanks to all our more experienced surveyors for completing your Autumn surveys, it’s great to have you with us as well.
So stick with us for the Winter Survey this June & July 2018 and let’s see what your next round of birding reveals!


